On April 22nd, 1998, we tested the device at Fort AP Hill.  Jason Regnier kindly came down
from Fort Belvoir to host us at AP Hill.  There, we collected data on eight replicas of
anti-personnel mines.  The mines were:  PMN, PMN-2, PMA-3, VS-MKII, VS50, TYPE 72, PMD-6,
and (another) plastic AP mine.  We buried these mines in the dirt mine lanes at AP Hill
and collected data using the device.  In addition to the mines, five discrimination objects
were also buried:  a can of beans, a piece of light scrap metal, a piece of heavy scrap
metal, a rock, and a  hunk of wood.  For each object, we took ten measurements (with
exceptions) with the acoustic probe, at five different probe locations.
sample spectra
Back home, we ran our very simple plastic mine discrimination algorithms against the
collected spectra.  The PMD-6 wood box mine is excluded from the data analysis; it
looks (acoustically) like a piece of wood and not like a plastic mine.  Here is the ROC
plot for the probability of mine detection versus probability of false alarm for each
spectrum:
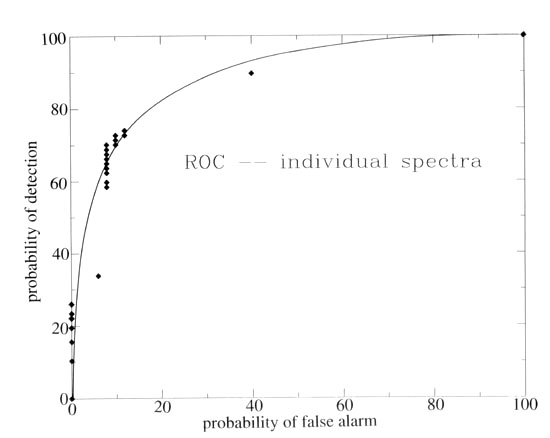
A suitable operating regime would be the point with Pd ~ 75% and Pfa ~ 10%.  With this
threshold, here is the breakdown on a per-object basis.


Detections per mine
- PMN 12/16
- PMN-2 5/10
- PMA-3 8/10
- VS-MKII 7/10
- VS50 9/10
- TYPE 72 7/11
- other plastic mine 9/10
total: 57/77 --> 74% Pd
Detections per innocuous object
- can 2/10
- thin metal piece 0/10
- thick metal piece 1/10
- rock 0/10
- wood stump 3/10
total: 6/50 --> 12% Pfa
By looking at the number of detections for each object, one could set a detection criterion
based on number of detections per object, rather than relying on one spectrum alone.
Here is a ROC plot for mine detection versus false alarm using the analysis of ten spectra
per object:
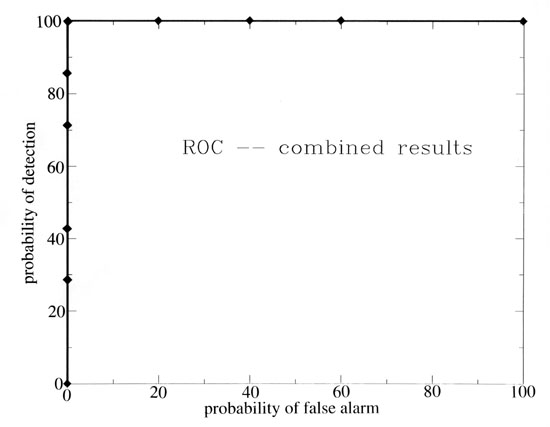
Using this method of taking a majority vote among multiple spectra for each object,
100% detection is achieved with no false alarms.  Clearly, one cannot rely on a
single measurement to positively identify a buried object.  Instead, multiple
measurements must be taken on each object.